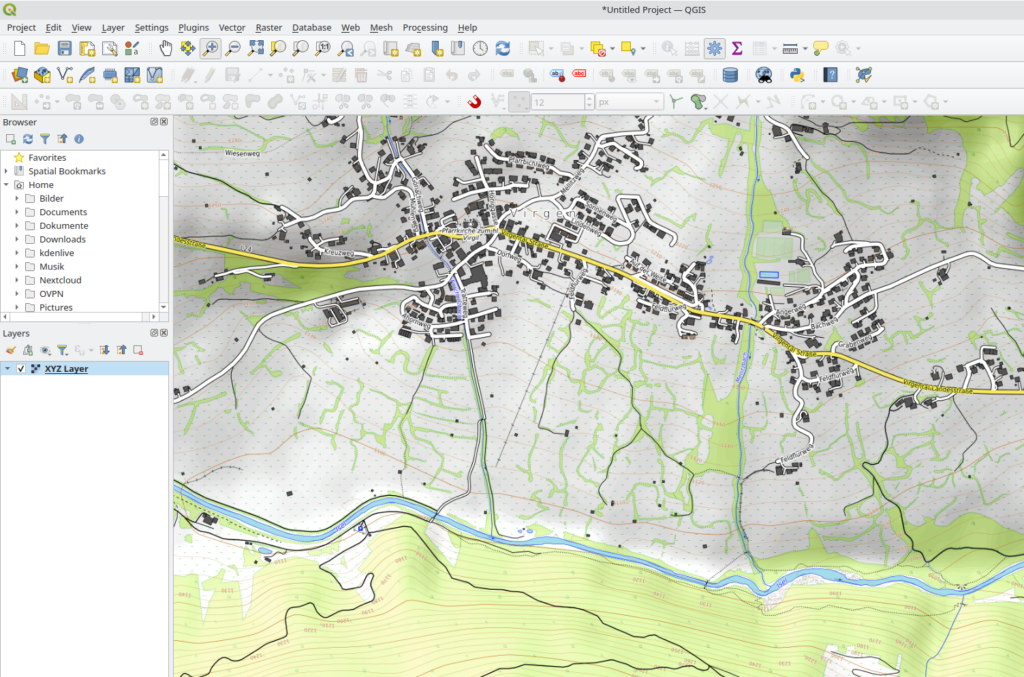
If you are on the look for an aesthetic worldwide topographic map (with contour lines, …) OpenTopoMap is worth a “visit” (https://opentopomap.org). With “XYZ-Connections” it is also a quite usefull basemap within QGIS projects.

If you are on the look for an aesthetic worldwide topographic map (with contour lines, …) OpenTopoMap is worth a “visit” (https://opentopomap.org). With “XYZ-Connections” it is also a quite usefull basemap within QGIS projects.

Thanks to the FOSS4G speech “FOSS4G – Cloud optimized formats for rasters and vectors explained,” I got first contact with the vector-format “FlatGeobuf” – and surprise also QGIS supports it 🙂 . That was an obvious starting point for testing it with some vector data and a poor network connection (~16 MBit).
FlatGeobuf – vector performance for the cloud (tested with QGIS 3.24) weiterlesen
Since the end of october 2021 the meteorological service of Austria (ZAMG) provides datasets for free on the “ZAMG Data Hub“.
In addition to typical meteorological data from weather-stations, also a category with “spatial data” is available – so let’s have a look on the data with QGIS and the NetCDF datasets with timestamps.
Using Austrian weather&climate data with QGIS – ZAMG Data Hub weiterlesen
Just for fun I gave Fedora and Gnome with version 34 a try again 🙂 One of the first things to do as a geoscientist has been the installation of QGIS… because of the not always up-to-date repo versions (and COPR), I selected the Flatpak-version… but got 3.16 LTS alltough I expected it to be 3.18.2 :-/ What I did not know, Flathub encapsulates 2 versions in one “Repo”.
Fedora and QGIS-Flatpak – LTS versus recent version weiterlesen
The nature observation platform observation.org provides a SQLite-dump of your observations. As a geospatial nerd it is obvious to have a deeper look on the database and how the location of the observations is stored… and to think one step further: Make a Spatialite database of it and use it directly in QGIS or ArcGIS.

From observation.org SQLITE dump to QGIS with Spatialite weiterlesen
QGIS 3.14 supports temporal data out of the box (many, many thanks to Anita Graser and the time manager plug-in in the previous versions of QGIS). The support of expressions within the temporal data settings could be really helpful 🙂

New QGIS 3.14 Temporal data support … it rocks with expressions weiterlesen
The Center for Systems Science and Engineering (CSSE) at Johns Hopkins University provides the famous Corona Dashboard and Map (ESRI ArcGIS Online App) and an ArcGIS Feature Service with the recent data (and a GIT Repo with the raw data). The ArcGIS Feature Server support of QGIS makes it easy to have “some fun” with QGIS and the provided datasets.

Corona COVID-19 meets QGIS – create your own maps weiterlesen
Not only people living in mountainous regions want to know the summarized positive and negative difference of altitude along a track (“line”). With QGIS 3.10 the new processing algorithm “climb along line” does the job for you.
Normally opening a geopackage in ArcGIS Pro (2.3.0) works fine, but recently I came across a new “nice” error-message: “Underlying DBMS error… gpkg is remote mounted and in WAL-mode“.
Playing around with QGIS and geodata containing a time dimension (e.g. animal tracking) offered me some nice possibilities. The “geometry generator” symbology and TimeManager PlugIn enable some nice visualizing workflows without generating new geodata.
Nice team: QGIS Geometry generator & Time manager PlugIn weiterlesen