Archiv der Kategorie: Sticked!

Fedora and QGIS-Flatpak – LTS versus recent version

Just for fun I gave Fedora and Gnome with version 34 a try again 🙂 One of the first things to do as a geoscientist has been the installation of QGIS… because of the not always up-to-date repo versions (and COPR), I selected the Flatpak-version… but got 3.16 LTS alltough I expected it to be 3.18.2 :-/ What I did not know, Flathub encapsulates 2 versions in one “Repo”.

Fedora and QGIS-Flatpak – LTS versus recent version weiterlesen

MapReduce for Education

MapReduce represents a pattern that had a huge impact on the data analysis and big data community.  Apache Hadoop allows to scatter and scale data processing with the number of nodes and cores.

One of the many corner points in this full framework is that code is shipped and executed on-site where the data resides. Next, only a pre-processed transformed version (map) of the data is then shuffled and sorted to the aggregators on different executors via the network.

MapReduce is hard to use on its own, so it usually is deployed with
Apache Hadoop or Apache Spark. To play around with it without either one of those large frameworks, I created one in Python – MapReduceSlim. It emulates all core features of the MapReduce. It has one difference, it loads each line of the files separately into the map function. In the case of Apache Hadoop, it would be block-wise. This provides a nice solution to understand the behavior and the pattern of MapReduce and how to implement a mapper and reducer.

Classic WordCount Example

Mapper function

# Hint: in MapReduce with Hadoop Streaming the 
# input comes from standard input STDIN
def wc_mapper(key: str, values: str):
    # remove leading and trailing whitespaces
    line = values.strip()
    # split the line into words
    words = line.split()
    for word in words:
        # write the results to standard 
        # output STDOUT
        yield word, 1

Reducer function

def wc_reducer(key: str, values: list):
    current_count = 0
    word = key
    for value in values:
        current_count += value
    yield word, current_count

Finally, call the function with the MapReduceSlim framework

# Import the slim framework
from map_reduce_slim import MapReduceSlim, wc_mapper, wc_reduce

### One input file version
# Read the content from one file and use the 
# content as input for the run.
MapReduceSlim('davinci.txt', 'davinci_wc_result_one_file.txt', wc_mapper, wc_reducer)

### Directory input version
# Read all files in the given directory and 
# use the content as input for the run.
MapReduceSlim('davinci_split', 'davinci_wc_result_multiple_file.txt', wc_mapper, wc_reducer)

Further information @ Github: https://github.com/2er0/MapReduceSlim


ArcGIS Pro 2.6 falls in love with (editing) Geopackage :-)

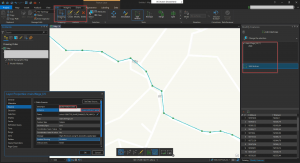
Good news for all users and fans of Geopackage – with ArcGIS 2.6 ESRI made it possible to edit features stored in a geopackage database directly 🙂 So after QGIS making geopackage it’s default “geodatabase”, ESRI also supports it including editing features.

I did a first workflow and ArcGIS Pro 2.6 did it’s job editing features stored in a geopackage 🙂

ArcGIS Pro 2.6 allows editing Geopackage geometries

ArcGIS Pro 2.6 falls in love with (editing) Geopackage 🙂 weiterlesen

From observation.org SQLITE dump to QGIS with Spatialite

The nature observation platform observation.org provides a SQLite-dump of your observations. As a geospatial nerd it is obvious to have a deeper look on the database and how the location of the observations is stored… and to think one step further: Make a Spatialite database of it and use it directly in QGIS or ArcGIS.

[1] Export your data from observation.org as SQLITE-dump:

Observation.org SQLite Download

From observation.org SQLITE dump to QGIS with Spatialite weiterlesen

R (rlang) and Plots everywhere

Data science and Jupyter notebook can sometimes get exhausting. What about debugging, version control, code reviewing and so on. Coming from a Software Engineering background it‘s like losing 50% of the stuff you were used to.

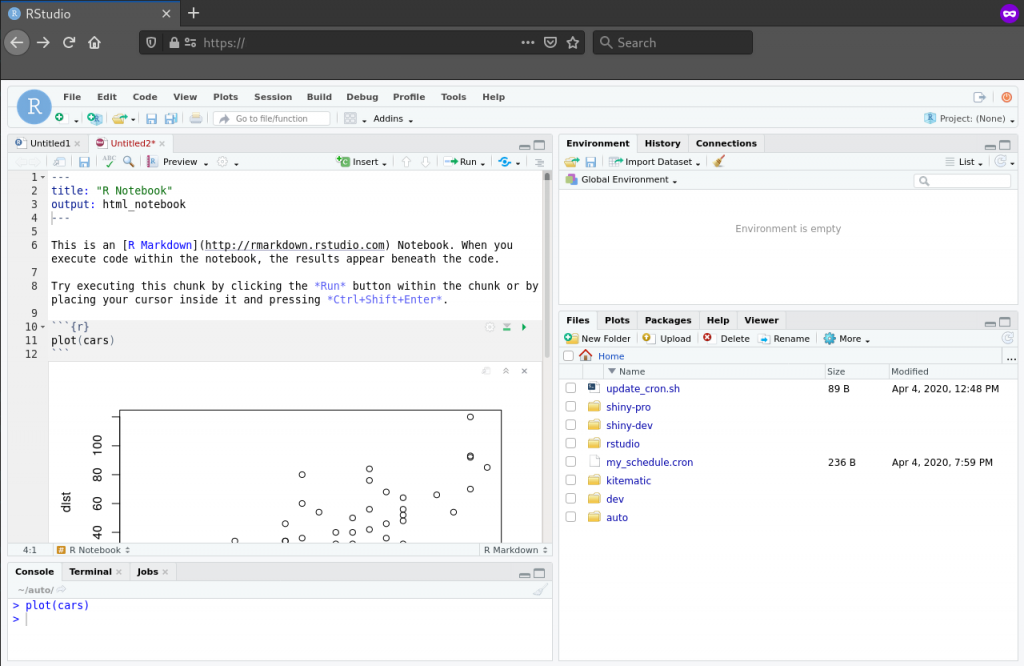
To mitigate those problems I recently partially switched from Python to R with many improvements. For local Python coding, JetBrains PyCharm is my tool of choice and Jupyter notebooks for remote coding. With R it is RStudio Desktop and for remote, there is RStudio Server, which is almost like the desktop version within a browser. This allows one to develop and analyze data from any device with a browser.

R-Studio Server with running R-Notebook sample

R (rlang) and Plots everywhere weiterlesen

Corona COVID-19 meets QGIS – create your own maps

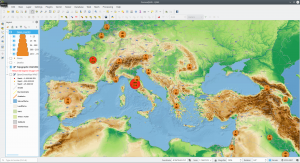
The Center for Systems Science and Engineering (CSSE) at Johns Hopkins University provides the famous Corona Dashboard and Map (ESRI ArcGIS Online App) and an ArcGIS Feature Service with the recent data (and a GIT Repo with the raw data). The ArcGIS Feature Server support of QGIS makes it easy to have “some fun” with QGIS and the provided datasets.

Coroa ArcGIS Feature Service data used in QGIS 3.12

Corona COVID-19 meets QGIS – create your own maps weiterlesen