Screenshot of Linus Tech Vessel channel, © Linus Tech, Vessel
A little over a year ago, Vessel launched as an alternative video platform, trying to demonopolize YouTube as the quasi only option to upload videos professionally (i.e. earn money with your videos).
To get a foot into the market, they made deals with a lot of Youtube personalities to upload to vessel a week in advance and instead of showing users advertisements, either in the form of prerolls or sponsor spots in the middle of the video, they collect a small monthly subscription fee. Vessel boldly announced their launch in the form of sponsored YouTube videos giving away a full year of premium subscriptions to everyone signing up in the first month or so.
In March 2016 the free premium accounts expired, and I wanted to know, how many people are still watching on vessel now, compared to when they had a free premium account.
Sadly, Vessel doesn’t disclose a view count, or how many people have purchased a premium account after the first month. They do however have a ‘like-button’ below every video and a comment counter. I decided to at least get a rough idea about their view count compared to last year.
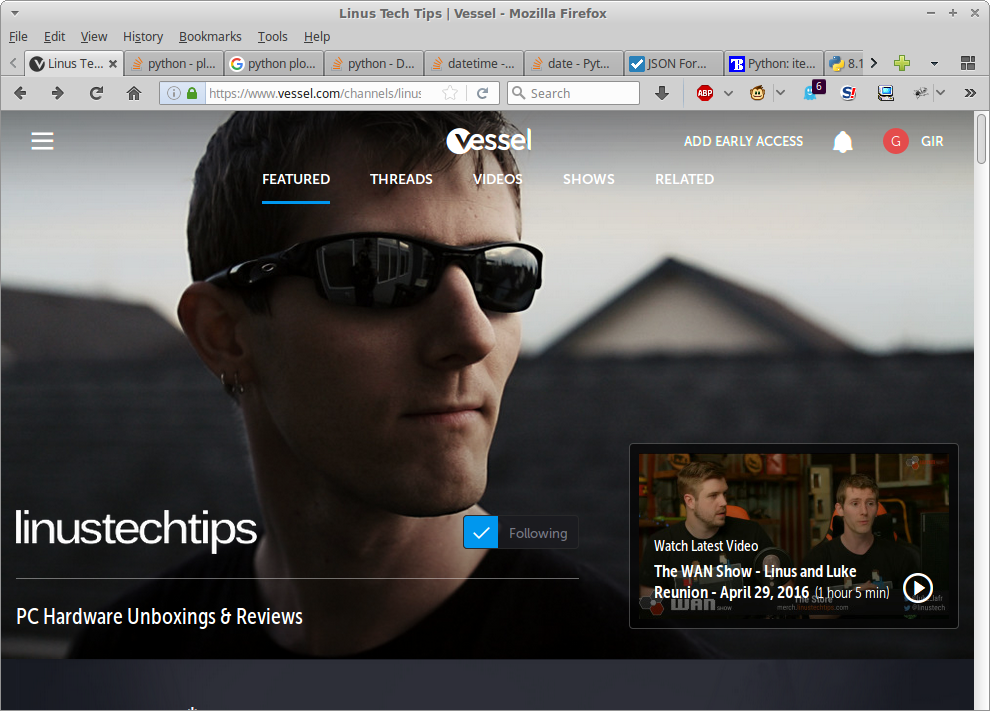
I started with the channel Linus Tech Tips (sadly, not a lot of Linux content, despite their name), as there seems to be a very active community around this one.
Using Firefox’ development tools, I managed to find out enough about their JSON-API to get a list of all the videos from a channel, and the like- and comment-count from those videos.
#!/bin/bash
#download video lists for linus tech tips channel

offset=0
while [[ $offset -lt 1115 ]]; do
        curl "https://www.vessel.com/api/content/items?type=video&ancestors=5455069242570208&limit=24&sort=-released_at&offset=$offset" > vidlist_$offset.json
        offset=$((offset + 24))
done
Using my limited Python skills, I extracted the video IDs (and optionally title and date of publishing) (which are in decimal format – not the same as in the URL for some reason).
import json
from sys import argv

script, filename = argv

json_file = open (filename)
#print (json_file.read())

#j = json.loads (json_file.read())
j = json.load (json_file)
#for i in range (0, len(j['items'])):
for i in range (0, 24):
	print (j['items'][i]['id'])
	#print (str(j['items'][i]['assets'][0]['id']) + ", " + j['items'][i]['title'] + ", " + j['items'][i]['released_at'] + "\n")
#!/bin/bash
for file in vidlist*; do
python parse_ltt.py $file >> vid_ids.txt
doneTo download the json containing all the juicy details about the videos, i made a simple vim macro. Starting with a video id on each line, i transformed it into a curl request.
qq0DpI
	curl -H "Content-Type: application/json" -X POST -d '{"client":"web"}' https://www.vessel.com/api/view/items/
<ESC>A
	 >vidids/
<ESC>pjq
1115@q
:w download_all.sh
(inserted text indented for your viewing pleasure; and if you wonder: yes, I wrote this down before typing it into vi :P)
This took a while – 18:37,31 to be exact
This information could also be used to create a Vessel-viewer or -downloader, as it even contains links (with tokens) to the streams in all qualities.
With a slightly modified version of the python script above, I can now parse the data and plot it with matplotlib
import json
import os
import time
import datetime
import matplotlib.pyplot as plt
import numpy as np

dates = []
likes = []
comms = []

path = 'vidids/'
listing = os.listdir(path)
for infile in listing:
	json_file = open ("vidids/"+infile)
	j = json.load (json_file)
	print ("uploaded: ", j['first_sunrise_at'], "\nlikes: ", j['like_count'], "\ncomments: ", j['comment_count'])
	print ("")

	dates.append (datetime.datetime.strptime(j['first_sunrise_at'], "%Y-%m-%dT%H:%M:%SZ"))
	likes.append (j['like_count'])
	comms.append (j['comment_count']);

order = np.argsort(dates)
xs = np.array(dates)[order]
ys = np.array(likes)[order]
zs = np.array(comms)[order]
plt.plot (xs, ys)
plt.plot (xs, zs)
plt.gcf().autofmt_xdate()
plt.show()
If I wanted, I could have checked the ‘Linus Tech Tips’ YouTube Channel and work out a viewcount to like/comment ratio andextrapolate the vessel view count. But it was getting late, so thats for someone else to do!

So, this is it. The graph IMO shows a clear drop in likes and comments at the end of March, when the free trials ended. I will do this again, in a more automated fashion later this year hopefully. Let’s see what will change till then. I really wish this alternative-to-youtube platform all the best!
If you wonder why I haven’t combined all those different scripts into a single, automated one: It was a test run, and debugging is easier that way. If I ever want to generate such graphs again, I will get rid of most of the manual work of course.